I had some free time this morning, so I decided to noodle around with Ubisoft’s financials and see if they are really in as dire financial straits as many here assume. I also wanted to see if the 20,000 employee head count was the main contributor to subpar financial performance.
The short answers are:
- The financials are not nearly as bad as I assumed.
- Employee head count is not causing poor performance (at least it isn’t as big a problem as most assumed).
I know you don’t want to take my word for that, so here is the evidence. The numbers below are all trailing twelve month data for the firms - but of course reporting periods don’t match up exactly so they are not 100% apples to apples.
Before I dive into the details I should note that there can be significant accounting differences between firms. Accounting rules have some flexibility and different firms may choose to account for some items differently. In this case we are also comparing three U.S. based firms to one European firm, so we have different accounting standards to deal with (GAAP vs IFRS). I’m going to gloss over those issues below.
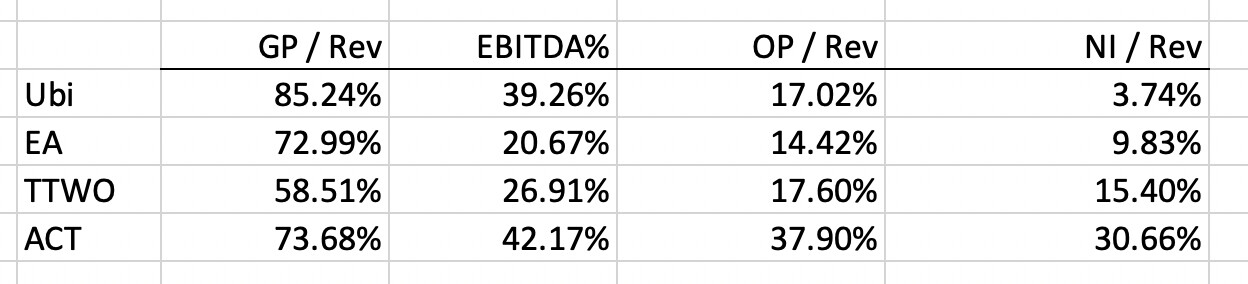
The numbers above are all profit margins at various levels of the income statement. As the table goes left to right, the margins go farther down the income statement. Employee expenses related to direct production of games should be affecting the first column (Gross Profit / Revenue). As you can see, Ubi has the highest margins in that category. More indirect employee expenses (overhead, R&D, sales and marketing) will show up in the second and third columns (EBTDA / Rev and Operating Profit / Rev). As you can see, Ubisoft is competitive with those margins as well. (I’ll address the big difference between the EBITDA and Operating margins in a bit).
The last column shows Net Income / Revenue, which is the number that has been discussed at great length here. That number certainly does look terrible for Ubi. However, if employee head count was causing the issue that would be affecting the numbers “higher up” the income statement as well. Not much happens on the income statement below Operating Income, but whatever is happening below that number is the main driver of Ubi’s terrible net profit margin. (more on this below).
I did a bit more digging to see if I could figure out what was going on. Here are the key numbers:
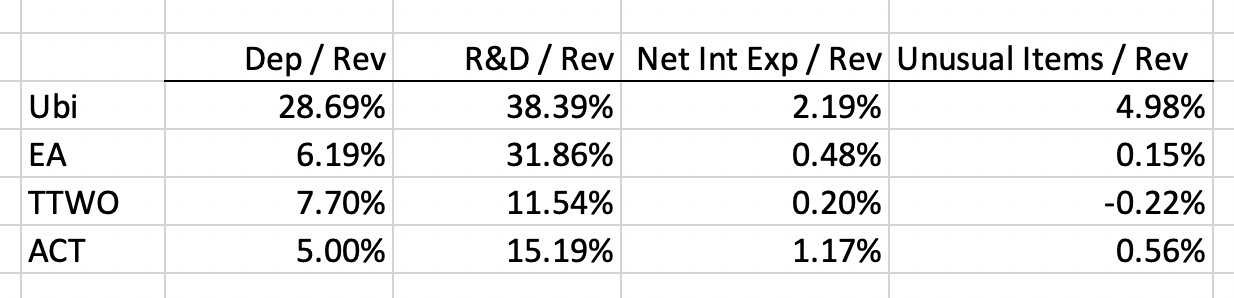
First, I wanted to explain the huge differences in some of the columns above. The main difference between the Gross Profit and Operating Profit columns is SG&A expense (marketing, overhead, etc.). One of the items included there is R&D. You can see that Ubi has by far the largest R&D of the four firms - literally three times higher than Take Two. I suspect all four firms are charging all engine development/maintenance costs to R&D. Many other factors could be affecting these numbers as well - including differences in accounting standards/choices.
I also wanted to explain the big difference in the EBITDA and Operating Profit columns. This is largely explained by the Depreciation / Revenue column above. For some reason Ubisoft has about 4x the depreciation expense of the other firms. (Depreciation expense is the mechanism by which firms recognize the gradual deterioration in the value of many assets - buildings, computers, etc.). I have no idea why Ubi’s depreciation is so high. This could be related to different accounting standards.
Finally, I wanted to investigate the big gap between Operating Profit and Net Profit for Ubi. The Net Interest Expense and Unusual Items columns above help explain that. Ubi has more interest bearing debt than its peers (at least on a relative basis) and thus more interest expense - four times more than the next closest firm. “Unusual Items” is a catch-all term for one-off or non-recurring charges or gains. These could be asset write downs, sales of assets at a loss or gain, etc. You can see Ubi had huge charges in the most recent year (and last year as well). I have no idea what the root issue is there.
Here is the interesting take-away from all the above:
- It appears that Ubi’s fundamental profit generation is inline with its peers.
- It does not appear that employee head count is the primary cause of whatever issues Ubi has.
- Most analysts (and potential buyers) will not care about the huge depreciation charge since it is a noncash expense.
- Most analysts (and potential buyers) are primarily concerned with pre-interest-expense performance. (If the interest expense is causing performance you don’t like then repay the debt)
- Most analysts (and potential buyers) are not really concerned with Unusual Items if they are truly non-recurring.
Ok, that is probably more than you wanted to know. Hopefully it interested some of you.
Please pardon any typos or related issues. I don’t have time to go back and edit right now.
Edit: In my haste, I originally flipped the interpretation of two of the expense columns above. I have now edited corrections in (I hope).